STOPS: Why and How
Too many e-mails concerning stops, stop placement and different aspects of this topic to omit it. Several articles will be devoted to this crucial part of trading.
A discussion of stop losses usually involves three parts. The first part is an explanation of the absolute necessity of applying a stop loss to any trade. I am going to assume that the reader knows very well that risk control is a crucial element of their survival in the markets. The second part concerns psychology and discusses the practical tricks that ensure a trader never goes into a “reasoning mode” and blows his or her stop. I'll get to this later. The third part is purely practical – where should a stop be placed? What factors should be considered? How should a stop be trailed when a trade moves in one’s favor? A practical aspect of placing stops is the topic of this article.
One very common notion says that a stop should be placed in such a way that it limits your loss to a certain amount – 1 to 2% of your trading capital is typically recommended. While limiting your losses to this amount is a sound recommendation, this approach is flawed if market movement is not factored in. Here is why: the market has no idea about your capital, your risk tolerance or even the fact that you are in trade. It moves by its own rules and patterns, and those patterns must dictate your stop placement. In other words, it’s a signal of a trade failure that tells you “Get out!” We will be back to the 1 to 2% rule later; at this point let’s define your major rule for a stop placement.
Your trade is stopped out when a reason for a trade is no longer there.
Let’s see how it applies in practice. Our first example assumes you are trading a Cup and Handle type of breakout (see Fig 1):
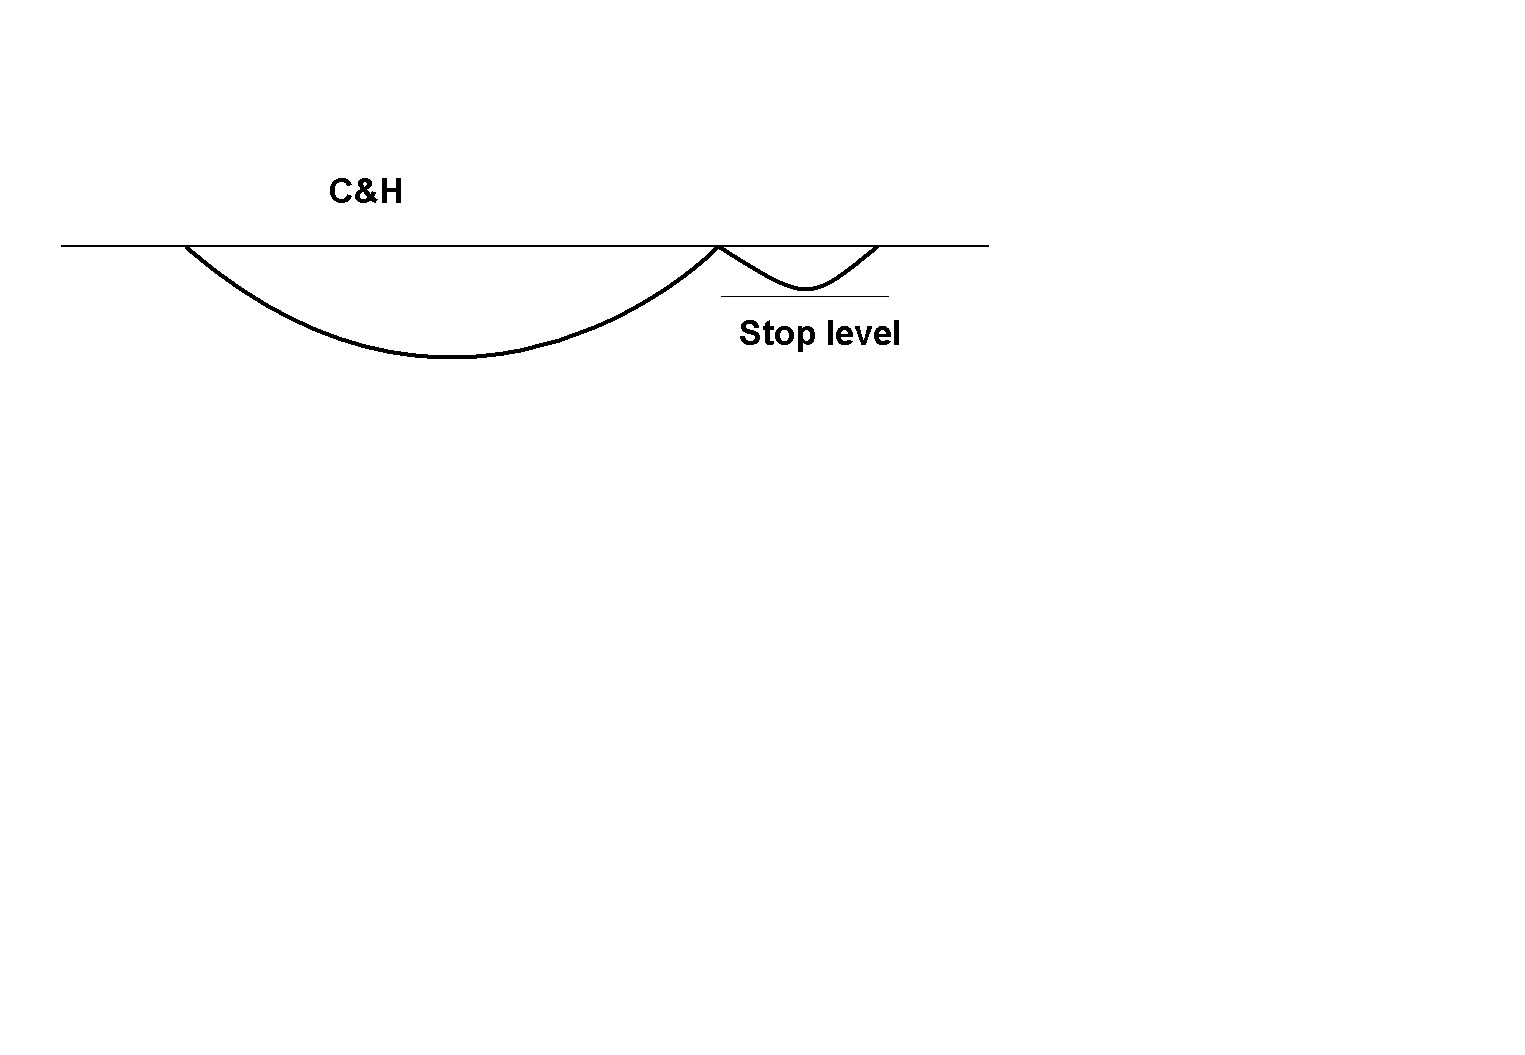
Fig 1. Cup and Handle
Let’s look into your reason for a trade, to find out what defines a failure. A Cup and Handle is a breakout setup that triggers your trade at the moment when a ‘rim’ is broken. A ‘handle’ bottom forms a higher low compared to a cup bottom, showing its closest support. The break of resistance, while holding support, serves as your reason for your trade. It means that if a trade reverses on you and breaks the latest support, your original reason for the trade is no longer there, and your trade is stopped out. That’s why the stop level is placed just under the handle’s bottom on Fig 1.
Let’s look at another example: a reversal trade off a Double Bottom (see Fig 2):

Fig 2. Double Bottom
In this case your trade is based on an assumption that a stock has formed support by testing it twice and is poised for bounce. Obviously, a break of this support renders your rationale as invalid and, therefore, a stop has to be placed under this level.
The two examples above refer to chart formations; but the same logic applies to any other approach. For instance, if you trade off technical indicators and use, let’s say, a stochastic oscillator, a reading below 20 is an entry signal for a reversal trade. In this case, if a stock pauses instead of bounces and a stochastic reading goes lower, you read it as a “no bounce” signal and close the trade. Notice that the same logic applies even to the trades based on fundamental data: remember the famous saying “If you buy a story, you have to sell when a story changes”?
The next aspect of a stop placement is a trailing stop. It applies to a situation where a trade moves in your favor and pauses, forming the next resistance. If you are a scalper, you simply take your profit at this point. However, if your objective is to let your profit run, you will want to protect your profits from evaporating. This is where a trailing stop comes into play, and the logic of its placement is very similar: it moves to any new support formed by a stock on its way. Here is the simplest example of such trailing (See Fig 3):

Fig 3. Stop trailing
If a stock formed a new higher low after the first stage of movement, this level becomes a new support and serves as an indication for a new stop level.
Now, armed with the logic of a stop placement you can apply it to any trading strategy you employ. And what about that 1 to 2% rule that we mentioned at the beginning of this article? Really, think about it. What do you do if a chart dictates a size of a stop that exceeds your risk tolerance? You factor it in by position sizing. Let’s see how it’s done. Assuming your trading capital is $30,000 and you want to keep your losses on any given trade to within 1%, you limit your losses to $250. If your trading lot is 1,000 shares and your setup shows a stop level as .25 cents, you are fine. If, however, a stop level dictated by the setup is .35 cents, you simply decrease your amount of shares for this trade to fit your risk tolerance – in this case to 700 shares. Do not forget to make sure your stock is liquid enough to absorb your shares – if a stock is too thin, you will need to factor in possible slippage, decreasing your shares even further.
Now, granted – this way to place and trail stops is very common and overly simplistic. In reality, everyday trading employs more sophisticated methods than utilizing this “common knowledge” to enhance your edge. When a strategy is widely used, it can become a subject of “contrarian trading” – an approach that puts you on the Smart Money side as opposed to the Public side. This strategy is going to be the subject of the next article.
posted by Vad @ 10:05 AM
0 Comments
![]()
![]()


0 Comments:
Post a Comment
<< Home